Mastering Micro-Influencers: How to Vetting and Scaling Nano-Influencer Campaigns for Local Markets

Three smartphones displaying nano-influencers promoting local businesses with engagement icons and social media metrics

Mastering Micro-Influencers: How to Vet and Scale Nano-Influencer Campaigns for Local Markets

In the world of digital marketing, bigger isn’t always better. While mega-influencers dominate headlines, a quieter revolution is happening at the local level one that delivers authentic engagement, higher conversion rates, and meaningful community impact. Enter nano-influencers: everyday people with 1,000-10,000 followers who wield surprising power in their hyper-local communities.

Futuristic AI robots showcasing micro-influencers with follower counts, engagement metrics, and growth analytics

Smart tools and data-driven strategies help scale micro and nano-influencer campaigns efficiently.

If you’re looking to connect with local markets in a genuine way, nano-influencer campaigns might be your secret weapon. Here’s how to vet, manage, and scale these campaigns effectively.

Why Nano-Influencers Are Perfect for Local Markets

Local influencer taking a selfie at a farmers market promoting authentic community engagement

Nano-influencers drive stronger local impact through trust, authenticity, and real community connection.

Nano-influencers typically boast:

  • High engagement rates (often 5-10%, compared to 1-2% for larger influencers)
  • Authentic relationships with their audience
  • Specialized knowledge of their local community
  • Cost-effectiveness for brands with smaller budgets
  • Authentic content that feels relatable rather than staged

For local businesses—from coffee shops to boutique fitness studios—these micro-voices can drive more foot traffic and loyalty than any generic ad campaign.


The Vetting Process: Finding the Right Fit

  1. Define Your Campaign Goals

Before you start searching, clarify what you want to achieve:

  • Brand awareness in a specific neighborhood?
  • Event promotion?
  • Product launches targeting local early adopters?

    Two people discussing at a local market event with campaign goals for brand awareness, event promotion, and product launches

    Strong campaigns start with clear goals. Define whether you want local brand awareness, event promotion, or product adoption.

  1. Look Beyond Follower Count

Dig deeper into these key metrics:

  • Engagement rate: Comments, shares, and saves relative to follower count
  • Audience quality: Are followers local? Do they engage meaningfully?
  • Content style: Does their aesthetic and voice align with your brand?
  • Past partnerships: How have they worked with other brands?
Infographic showing engagement rate, audience quality, and content style as key influencer selection metrics

Choosing the right influencer means looking beyond follower numbers and focusing on engagement, audience quality, and content style

  1. Assess Authenticity
  • Check if their followers are real (beware of bought followers)
  • Read through comments to gauge genuine community interaction
  • Look for consistent themes in their content that show true passion
Smartphone showing social media comments with tips to check fake followers and assess genuine influencer engagement

Authenticity beats numbers. Look for real followers, real conversations, and real passion.

  1. Evaluate Professionalism
  • Response time to inquiries
  • Quality of communication
  • Willingness to understand your brand goals
Infographic showing response time, communication quality, and understanding brand goals for influencer professionalism

Professionalism matters when scaling from one influencer to many.

Scaling Your Campaign: From One to Many

Managing multiple nano-influencers might seem daunting, but these strategies can help:

  1. Create a Streamlined Onboarding Process
  • Develop clear brand guidelines specific to nano-influencers
  • Create templates for agreements, briefs, and content submission
  • Set up a simple system for product delivery or service access
Infographic showing onboarding steps for nano-influencers including brand guidelines, templates, and delivery systems

A smooth onboarding process helps nano-influencers create better content, faster.

  1. Leverage Tools for Management
  • Use platforms like Grin, Upfluence, or even tailored Trello boards
  • Create shared calendars for content deadlines
  • Establish a dedicated communication channel (Slack, email group)
Workspace with laptop, Trello board, Slack, calendar, and influencer management tools for campaign coordination

The right tools make managing multiple nano-influencers simple and scalable.

  1. Develop Scalable Content Frameworks
  • Provide creative direction while allowing personal interpretation
  • Create hashtag campaigns that unite individual efforts
  • Develop content templates that maintain brand consistency while encouraging personal touches
Creative team collaborating on scalable content frameworks, hashtag campaigns, and brand-consistent templates

Scale content without losing your brand voice.

  1. Implement Efficient Tracking
  • Use unique discount codes for each influencer
  • Create UTM parameters for link tracking
  • Set up local landing pages to measure geographic impact
Billboard graphic showing influencer tracking with UTM links, discount codes, geographic impact, and ROI growth

Track smarter. Measure local impact. Improve ROI.

Building Lasting Local Relationships

Unlike one-off campaigns with larger influencers, nano-influencer partnerships can evolve into long-term community relationships:

  • Offer exclusivity: Make them feel like true brand ambassadors
  • Provide experiences: Invite them to special events or previews
  • Create a community: Connect your nano-influencers with each other
  • Seek their input: They know their audience best—listen to their insights
Diagram showing influencer network growth from one-off campaigns to community-driven partnerships

Move beyond one-off campaigns and build lasting influencer communities.

Measuring Success Beyond the Numbers

While metrics matter, the true value of nano-influencer campaigns often lies in:

  • Local brand sentiment: Are people talking about you in the community?
  • User-generated content: How much authentic content are you accumulating?
  • Long-term loyalty: Are customers returning and mentioning how they found you?
  • Competitive local positioning: Are you becoming the “neighborhood favorite”?
Illustration showing brand growth metrics like local sentiment, user-generated content, loyalty, and community positioning

True success is more than numbers. Measure sentiment, loyalty, and community impact.

The Future Is Local and Authentic

As consumers increasingly crave authentic connections and community relevance, nano-influencer campaigns offer a powerful way to build genuine local presence. The trust they’ve cultivated with their modest following often translates into higher conversion rates and more meaningful brand relationships.

Woman showing a mobile post in a café with friends, representing authentic local influencer connections and community trust

Local influence builds real trust. Authentic connections drive stronger community impact.

Remember: In the world of nano-influencers, authenticity always outperforms polish. Your willingness to embrace local voices, imperfect content, and genuine relationships will set your brand apart in an increasingly crowded digital landscape.

Ready to go micro? Your most loyal customers might already be talking about you—you just need to find the right amplifiers in your local community.

The Automated Agency: Tools We Use to Save 10+ Hours Per Week on Scheduling and Reporting

Futuristic illustration of a robot using automation tools connected to a laptop dashboard for scheduling and reporting

Let’s be real. If you run an agency, your most valuable resource isn’t creativity—it’s time.

Yet too many of us spend it on tasks that feel important but don’t move the needle: emailing back-and-forth to schedule calls, manually formatting reports, and chasing down client approvals. This isn’t just tedious; it’s expensive.

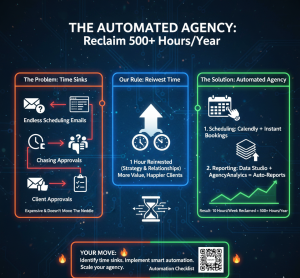
Infographic showing the transition from agency time sinks like endless emails to automated scheduling and reporting solutions.

Moving from manual “time sinks” to an automated agency model can reclaim over 500 hours per year.

We made a rule: for every hour we save on operations, we reinvest an hour into strategy or client relationships. That rule led us to build what we call The Automated Agency.

By leveraging a specific set of tools for two of our biggest time sinks—scheduling and reporting—we’ve systematically reclaimed over 10 hours per week. That’s an extra 500+ hours per year for higher-value work.

Here’s our exact playbook, including the tools, our setup, and how much time they save.

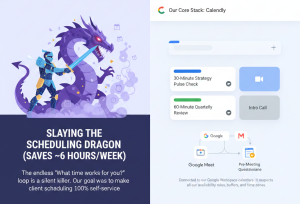
Part 1: Slaying the Scheduling Dragon (Saves ~6 Hours/Week)

The endless “What time works for you?” loop is a silent killer. Our goal was to make client scheduling 100% self-service.

Illustration of a knight fighting a dragon next to a digital interface showing automated meeting types and integrations.

End the “What time works for you?” loop by making client scheduling 100% self-service.

Our Core Stack:

Calendly (for the simplicity win)

    • What we use it for: All standard client calls, intro calls, and internal meetings.
    • The Automation: Connected to our Google Workspace calendars. It respects all our availability rules, buffers, and time zones.
    • Pro Setup: We created multiple event types (e.g., “30-Minute Strategy Pulse Check,” “60-Minute Quarterly Review”). Each automatically attaches the relevant Google Meet link and a pre-meeting questionnaire via the integration with…

Typeform

      • What we use it for: Pre-call discovery forms.
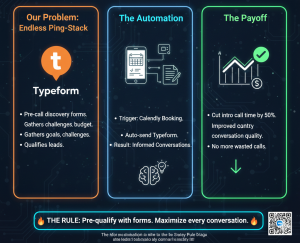
      • The Automation: When a client books a “New Project Discovery” call in Calendly, they are automatically sent a Typeform to complete. This asks about goals, challenges, and budget before we speak. This has cut intro call time by 50% and drastically improved the quality of our conversations.
Workflow diagram showing a Calendly booking triggering an automated Typeform for lead qualification.

Automating discovery forms can cut intro call times by 50% while improving conversation quality.

SavvyCal (for high-touch, complex scheduling)

    • What we use it for: Multi-stakeholder meetings, team alignment sessions.
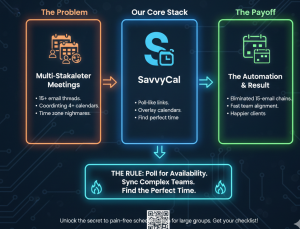
    • The Difference: SavvyCal lets us send a poll-like link where internal and client teams can overlay their availabilities to find the perfect time. It eliminated the 15-email chain to coordinate 4 calendars.
Diagram contrasting the problem of coordinating 4+ calendars with the solution of using poll-like availability links.

Use poll-style links to find the perfect meeting time for complex teams and eliminate 15-email chains

The Time Saved:

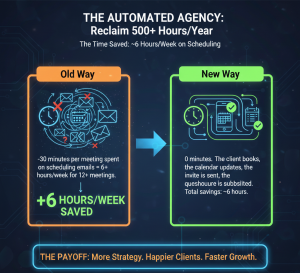
  • Old Way: ~30 minutes per meeting spent on scheduling emails = 6+ hours/week for 12+ meetings.
  • New Way: 0 minutes. The client books, the calendar updates, the invite is sent, the questionnaire is submitted. Total savings: ~6 hours.
Comparison chart titled "The Time Saved" showing the old way of manual emails versus the new automated booking way.

The goal isn’t just to save time; it’s to eliminate the task entirely.

Part 2: Automating the Reporting Grind (Saves ~4+ Hours/Week)

Monthly reporting was a soul-crushing, copy-paste marathon from 8 different platforms into a PowerPoint. No longer.

Our Core Stack:

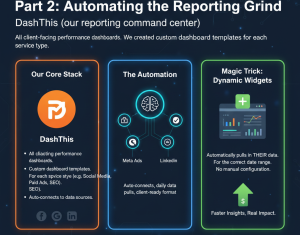
DashThis (our reporting command center)

    • What we use it for: All client-facing performance dashboards.
    • The Automation: We created custom dashboard templates for each service type (e.g., Social Media Management, Paid Ads, SEO). DashThis auto-connects to our data sources (Meta Ads, Google Analytics, LinkedIn, etc.), pulls in the data daily, and displays it in a beautiful, client-ready format.
    • Magic Trick: We use Dynamic Widgets. When we add a new client to a template, it automatically pulls in their data for the correct date range. No manual configuration.
Infographic detailing DashThis automation, showing dynamic widgets and daily data pulls from Meta Ads and LinkedIn.

Customize at scale and eliminate manual setup with dynamic reporting widgets.

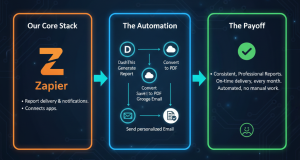
Zapier (the glue)

    • What we use it for: Report delivery and notifications.
    • The Automation: We have a “Zap” that: On the 3rd of each month, triggers DashThis to generate the latest report for Client X > Converts it to a PDF > Saves it to a dedicated Google Drive folder > And then sends a personalized email via Gmail to the client with the PDF link and 2-3 key insights pulled from the dashboard.
    • The client receives a consistent, professional report on the same day every month, and we don’t lift a finger.
Comparison chart titled "The Time Saved" showing the old way of manual emails versus the new automated booking way.

The goal isn’t just to save time; it’s to eliminate the task entirely.

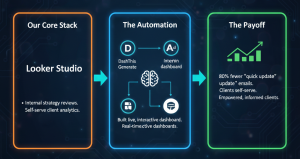
Google Data Studio / Looker Studio (for deep-dive analytics)

    • What we use it for: Internal strategy reviews and clients who love to self-serve.
    • The Automation: We built a live, interactive dashboard that updates in real-time. Clients with logins can check KPIs anytime. This has reduced the “Can I get a quick update?” emails by about 80%.
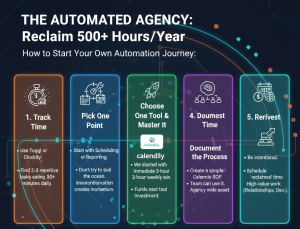
A 5-step roadmap for agency automation: Track Time, Pick One Point, Choose One Tool, Document the Process, and Reinvest.

Automation doesn’t happen overnight; it starts with tracking your time and picking one small win.

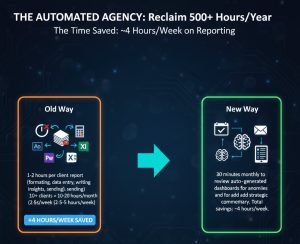
The Time Saved:

  • Old Way: 1-2 hours per client report (formatting, data entry, writing insights, sending) x 10+ clients = 10-20 hours/month (2.5-5 hours/week).
  • New Way: 30 minutes monthly to review auto-generated dashboards for anomalies and add strategic commentary. Total savings: ~4 hours/week.
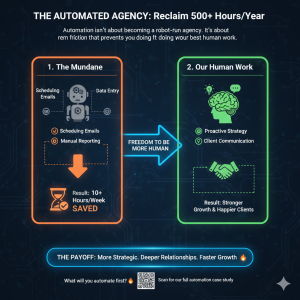
Diagram showing the transition from "The Mundane" (scheduling and data entry) to "Human Work" (proactive strategy and client communication).

Remove the friction of mundane tasks to focus on the strategic work only humans can do.

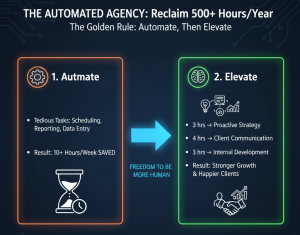
The Golden Rule: Automate, Then Elevate

Automation isn’t about replacing human touch; it’s about freeing us to be more human. The 10+ hours we save weekly are now strategically reinvested:

  • 3 hours → Proactive Strategy: We now hold monthly “innovation hours” for each client to brainstorm new opportunities, rather than just reporting on the past.
  • 4 hours → Client Communication: More check-in calls, voice notes, and strategic emails that build the relationship, not just transact.
  • 3 hours → Internal Development: Improving our processes, learning new platforms, and team training.
Infographic split between "Automate" (tedious tasks) and "Elevate" (strategy, communication, and development).

The goal of saving 10 hours a week isn’t just to work less—it’s to do better work

How to Start Your Own Automation Journey:

  1. Track Your Time for One Week: Use Toggl or Clockify. You’ll likely find 2-3 repetitive tasks eating 30+ minutes daily.
  2. Pick One Pain Point: Start with either scheduling or reporting. Don’t try to boil the ocean. Mastering one automation creates momentum.
  3. Choose One Tool and Master It: We started with Calendly. It gave us an immediate 3-hour weekly win that funded our next tool investment.
  4. Document the Process: Once it works, create a simple SOP so your team can use it. This turns your personal time-saver into an agency-wide asset.
  5. Reinvest the Time, Don’t Just Bank It: Be intentional. Schedule the “reclaimed” time in your calendar for high-value work before it gets filled by other low-value tasks.
Diagram showing the transition from "The Mundane" (scheduling and data entry) to "Human Work" (proactive strategy and client communication).

Remove the friction of mundane tasks to focus on the strategic work only humans can do.

Automation isn’t about becoming a robot-run agency. It’s about removing the friction that prevents you from doing your best, most human work. By letting machines handle the mundane, we’ve not only saved 10+ hours a week—we’ve become a better, more strategic, and more responsive partner to our clients.

A 5-step roadmap for agency automation: Track Time, Pick One Point, Choose One Tool, Document the Process, and Reinvest.

Automation doesn’t happen overnight; it starts with tracking your time and picking one small win.

The tools are out there. The time is now. What will you automate first?

Curious about a specific setup? Have a tool that saves you hours? Share it below—let’s build the automated agency playbook together.

Scoping the Perfect Project: How Our Agency Calculates Your Real Social Media Budget.

Business professionals collaborating around a digital table displaying project scope analysis and social media budget allocation in a modern office

Scoping the Perfect Project: How Our Agency Calculates Your Real Social Media Budget

“What’s this going to cost?”

It’s the question at the heart of every new agency partnership. And if you’re like most businesses, you’ve likely received quotes that feel arbitrary—a number pulled from thin air with little explanation.

A team of three analysts reviewing a digital funnel that converts social media engagement and data into "Real Investment $."

Ensuring transparency and customized planning to turn data into a real investment

At our agency, we believe your budget shouldn’t be a mystery. It should be a direct reflection of your goals, built with transparency from the ground up. We don’t have “package pricing.” We have a scoping process that determines your real investment.

Here’s a behind-the-scenes look at how we calculate what it actually takes to win for you on social media.

The Myth of the “Average” Budget

First, let’s dispel a common myth: there is no one-size-fits-all social media budget. A local bakery and a B2B SaaS startup have fundamentally different landscapes, audiences, and conversion paths.

A split screen comparing the marketing environment of a local bakery (BakerySocial) and a global SaaS startup

Why a “Standard Package” must be flexible enough to accommodate different business models

Anyone offering a standard package is selling you a service, not a solution.

Your real budget is the sum of three core components:

  1. Strategy & Intelligence (The Foundation)

  2. Content & Creativity (The Engine)

  3. Management & Growth (The Amplifier)

A vertical infographic showing three budget components: Strategy & Intelligence (The Foundation), Content & Creativity (The Engine), and Management & Growth (The Amplifier).

Breaking down the “Standard Package” into its three essential functional areas

Let’s break down how we scope each.

Phase 1: Strategy & Intelligence – Mapping the Territory

Before we create a single post, we need a map. This phase answers: Where are we now, where do we want to go, and what’s standing in our way?

Two professionals analyzing a global digital map and data charts during Phase 1: Strategy & Intelligence

Mapping the territory through in-depth audits, competitive analysis, and goal setting.

What We Scope:

  • Competitive Audit: How many key competitors do we need to analyze? What’s the depth of analysis (platforms, content, audience sentiment)?

  • Audience Research: Are we building personas from scratch or refining existing ones? What tools and data sources are required?

  • Channel Strategy: Which platforms are non-negotiable? Which are test-and-learn? This dramatically impacts resource allocation.

  • Goal & KPI Framework: Are we driving brand awareness, lead generation, or direct sales? Each requires different tracking and reporting complexity.

A four-panel infographic showing the stages of scoping: Competitive Audit, Audience Research, Channel Strategy, and Goal & KPI Framework.

A comprehensive look at the foundational elements defined during our scoping process.

How This Translates to Budget:
A 3-competitor audit for a clear niche requires less time than a 10-competitor analysis in a fragmented market. A pure brand awareness goal is scoped differently than a multi-touchpoint attribution model. We quantify the hours for this discovery work upfront. This is your strategic foundation, and it’s non-negotiable for success.

Two digital tablets displaying a detailed "Content Matrix" grid with specific post counts for Instagram and LinkedIn, highlighting asset creation and copywriting costs.

Our Content Matrix provides a transparent breakdown of exactly what your investment covers.

Phase 2: Content & Creativity – Building the Assets

This is often the most variable part of the budget. Content is not a commodity. A generic graphic costs little. A mini-documentary-style video or a data-driven interactive carousel costs more. Quality, volume, and format dictate scope.

A three-part layout featuring a digital artist creating graphics, a videographer filming a subject, and a person interacting with a touchscreen interface.

Phase 2 is where your brand comes to life through custom graphics, professional video, and interactive experiences.

What We Scope:

  • Content Mix & Volume: How many posts per platform, per month? What’s the ratio of “hero” (high-production) vs. “hub” (educational) vs. “help” (engaging) content?

  • Asset Creation: Does this require photography, custom illustration, video production, or motion graphics? Are we using UGC (User-Generated Content) or licensing stock?

  • Copywriting & Storytelling: Is the voice established, or are we developing it? Is the subject matter highly technical, requiring expert interviews or deep research?

An infographic showing social media icons being funneled into a dollar sign, alongside photography equipment and an open book for storytelling.

We calculate your budget by scoping three main areas: Content Mix, Asset Creation, and Storytelling.

How This Translates to Budget:
We provide a Content Matrix in our proposal. It’s a clear grid that outlines, for example:

  • *8 Instagram feed posts/month: 2 high-production videos, 4 designed carousels, 2 curated UGC highlights.*

  • *12 LinkedIn posts/month: 4 long-form industry insights, 6 company updates, 2 engagement prompts.*
    You see exactly what you’re paying for. No surprises.

Phase 3: Management & Growth – Driving the Results

Posting content is just the start. This phase encompasses community building, performance analysis, and paid amplification.

A three-panel infographic showing a team engaging in community building, a laptop displaying performance analysis charts, and a megaphone icon representing paid amplification.

Phase 3 focuses on driving results through active engagement, data-driven insights, and targeted ad spend

What We Scope:

  • Community Management: Are we responding to comments and DMs daily? Is the audience size and engagement level requiring a dedicated community manager?

  • Reporting & Optimization: Are we delivering a standard monthly report or a real-time dashboard with weekly optimization check-ins?

  • Ad Budget & Management: This is separate from our fees. We advise on the optimal paid media budget to achieve your goals, and we scope our time to manage those campaigns (creative adaptation, audience testing, bid optimization).

A three-panel infographic showing people interacting with social icons, a laptop screen with data analytics, and a stack of gold coins with "ADS" and growth arrows.

Our core pillars: Community Management, Reporting & Optimization, and Ad Budget & Management.

How This Translates to Budget:
We calculate the dedicated hours per week required for active engagement and performance monitoring. For ad management, our fee is typically a percentage of the ad spend we manage or a fixed monthly retainer for a defined scope of work. We are always clear on this distinction.

The Formula: Bringing It All Together

So, what’s the final number? It’s the sum of the hours (or resources) for each phase, valued appropriately.

Real-World Example: A B2B Tech Startup

  • Goal: Generate qualified leads via LinkedIn & Twitter.

  • Scope:

    • Strategy: Deep-dive on 5 key competitor funnels. Build 3 buyer personas.

    • Content: 15 posts/month. Mix = 3 flagship “explainer” videos, 8 data-visualization carousels, 4 CEO thought-leader snippets.

    • Management: Daily engagement, weekly performance tweaks, management of a $5k/month LinkedIn ad budget.

Infographic showing the three pillars of a B2B tech startup marketing campaign: Strategy, Content, and Management for LinkedIn and Twitter.

A visual breakdown of how we approach B2B lead generation through strategic content and active management.

Budget Structure:

    • Agency Retainer: $X (covers strategy, content creation, organic management)

    • Recommended Ad Spend: $5,000 (paid directly to the platform)

    • Ad Management Fee: $Y (or a % of ad spend)

A horizontal flow chart showing Agency Retainer plus Recommended Ad Spend plus Ad Management Fee equals total investment.

A transparent look at how every dollar is allocated to drive your marketing results.

We present this total investment clearly, showing exactly how each dollar is allocated to drive the result.

Our Promise: Transparency from Day One

When we present a proposal, you won’t just see a total figure. You’ll see:

  1. A Project Scope Summary tying every task back to your specific goal.

  2. A Clear Deliverables Matrix outlining the content and reporting you receive.

  3. A Breakdown of Investment distinguishing between our services and your ad budget.

  4. A 90-Day Roadmap showing what success looks like in the first quarter.

Four-panel infographic showing Project Scope Summary, Clear Deliverables Matrix, Breakdown of Investment, and a 90-Day Roadmap.

Beyond just a number: What you receive in every project proposal.

We believe an informed partner is the best partner. By understanding exactly what goes into your social media success, we build a foundation of trust—and that’s where the real growth begins.

Ready to scope your perfect project? Let’s start with your goal, not our invoice.

The 5 Essential Reports Every Client Should Receive: A Guide to Transparent Social Media Reporting

Split screen comparison showing dense reports versus clear transparent dashboard insights.

In the fast-paced world of social media, results are everything—but without clear, honest reporting, even great results can feel invisible.

For agencies and freelancers, reporting isn’t just a task to check off; it’s an opportunity to build trust, demonstrate value, and turn data into decisions.

Boardroom scene with holographic icons representing performance overview, financial breakdown, milestones, market analysis, and strategy forecast.

Five reports. One clear roadmap to smarter growth.

Too often, clients are handed dense PDFs filled with vanity metrics that raise more questions than they answer. Transparency changes that. It transforms reporting from a one-way delivery into a two-way conversation about growth.

Here are the five essential reports every client should receive to ensure clarity, confidence, and collaboration.

Business team reviewing performance dashboards and engagement metrics during a collaborative meeting.

When clients see clarity, trust follows. Strong reporting builds stronger partnerships.

  1. The Performance Snapshot: The “What Happened” Report

Purpose: To provide a top-line view of campaign or monthly performance.

Digital tablet displaying performance metrics including conversion growth and engagement decline charts.

See the wins. Spot the gaps. Know exactly what happened this cycle.

Transparency Angle: Starts the conversation with honesty—celebrating wins and acknowledging areas that didn’t meet targets without sugar-coating.

What to Include:

Dashboard showing key learnings, recommended actions, upcoming opportunities, and revised goals in a clean infographic layout.

From insights to action. These four pillars keep every report sharp, focused, and impactful.

  • Key Metrics Overview: Reach, engagement rate, follower growth, and clicks.
  • Goal Tracking: A clear visual (like a progress bar) showing how performance stacked up against the objectives set at the outset.
  • Top & Bottom Performing Content: 2-3 examples of each with brief context on why they likely performed that way.
  • One-Sentence Summary: “This month, we exceeded our engagement goal by 15% through video content, though reach was slightly lower due to algorithm shifts.”
  1. The Audience & Insights Report: The “Who & Why” Report

Purpose: To move beyond numbers and humanize the audience, proving you understand who you’re speaking to.

Two professionals reviewing audience demographics and engagement insights on a futuristic digital dashboard.

Decode who your audience is and why they engage. Turn data into clarity, not confusion.


Transparency Angle: 
Shows the client you’re not just broadcasting but listening and adapting to their community.

What to Include:

Audience dashboard showing demographic shifts, peak online times, content affinity, and sentiment analysis.

Know who they are, when they’re online, what they love, and how they feel.

  • Demographic Shifts: Notable changes in audience location, age, or gender.
  • Peak Online Times: When their audience is most active.
  • Content Affinity: What topics or formats (e.g., Reels, carousels, industry news) generated the most positive reactions.
  • Sentiment Analysis: A qualitative look at comments and mentions—is the conversation positive, curious, or concerned?
  1. The Conversion & ROI Report: The “Business Impact” Report

Purpose: To connect social media activity directly to business goals.

Transparent analytics dashboard showing revenue attribution, lead generation, website traffic, and return on ad spend.

Because real success isn’t likes. It’s revenue, growth, and ROI.

Transparency Angle: This is where trust is solidified. It answers the client’s ultimate question: “What am I getting for my investment?”

What to Include:

Digital dashboard displaying lead generation, website traffic, cost per result, and ROI calculation metrics.

From clicks to conversions, every metric tells a business story.

  • Lead Generation: Form completions, sign-ups, or direct inquiries from social.
  • Website Traffic: Sessions and behavior from social referrals (using UTM parameters).
  • Cost-Per-Result: If running ads, show cost per link click, lead, or purchase.
  • ROI Calculation: For e-commerce or direct sales clients, attribute revenue where possible. For others, frame ROI as cost per lead against industry benchmarks.
  1. The Competitive Landscape Report: The “Context” Report
Market benchmarking dashboard showing competitor performance, industry trends, and strategic growth indicators.

Context turns numbers into strategy. Benchmark smarter, compete stronger.

Purpose: To benchmark performance within the market landscape.
Transparency Angle: Demonstrates strategic thinking and shows that you’re keeping an eye on the horizon, not just the client’s own metrics.

What to Include:

Dashboard showing share of voice, follower growth comparison, engagement rate benchmark, and competitive content analysis.

Winning isn’t just about your numbers. It’s about knowing how you stack up in the market.

  • Share of Voice: How much of the online conversation in your niche is about the client vs. 2-3 key competitors.
  • Follower Growth Comparison: Presented as a trend line over time.
  • Engagement Rate Benchmark: How the client’s ER stacks up against competitors.
  • Competitive Content Analysis: Note any successful campaigns or content themes from competitors that are worth noting.
  1. The Forward-Looking Strategy Report: The “What’s Next” Report

Purpose: To pivot from looking backward to planning forward, collaboratively.

Business professional viewing a futuristic growth path with upward arrow, innovation icons, and city skyline at sunrise.

Strategy isn’t about today. It’s about where you’re heading next.

Transparency Angle: Invites the client into the planning process, making them a partner in the strategy based on the data you’ve just shared.

What to Include:

Four-panel infographic highlighting key learnings, recommended actions, upcoming opportunities, and revised goals.

Insights are useless without action. This is how strategy stays sharp.

  • Key Learnings: 2-3 major takeaways from the data (e.g., “Video tutorials drive 3x more engagement than static posts.”).
  • Recommended Actions: Clear, actionable steps for the next period. (e.g., “We recommend shifting to two video tutorials per month and testing a new ad audience based on our top-performing post.”).
  • Upcoming Opportunities: Notes on seasonal trends, upcoming platform features, or content tests to run.
  • Revised Goals: A proposal for updated or continued goals for the next reporting period.

How to Deliver These Reports for Maximum Clarity

Infographic showing four reporting best practices: combine in a dashboard, present insights, keep it simple, and stay consistent, with human and AI collaboration visuals.

Great reporting isn’t sent. It’s experienced.

  1. Combine in a Dashboard: Use a tool like Google Data Studio, DashThis, or AgencyAnalytics to create a live, interactive dashboard. This gives clients access to real-time data and embodies transparency.
  2. Present, Don’t Just Send: Schedule a 30-minute review meeting. Walk through the reports, tell the story of the data, and use the Forward-Looking Strategy Report as the agenda for the second half of the call.
  3. Keep It Simple: Avoid jargon. Explain why a metric matters. A graph showing “Engagement Rate Up 20%” is good; a graph with the caption “Engagement Rate Up 20% Because Our Question-Based Carousels Sparked Conversation” is better.
  4. Be Consistent: Deliver reports on a regular, predictable schedule. Consistency builds reliability.

Transparent reporting isn’t about overwhelming clients with data. It’s about empowering them with insight. By providing these five essential reports, you shift the narrative from “What did you do for me this month?” to “Here’s what we learned together, and here’s how we’re going to win next month.”

That’s the kind of partnership that lasts

Two professionals shaking hands while reviewing digital performance insights and strategic growth visuals in a modern office.

When insights replace noise, partnerships get stronger.

Ready to transform your reporting? Start by building your Performance Snapshot this month and build from there.

Audio-First Strategy: How Brands Are Winning on Spotify and Podcasts Outside of Standard Ads

Audio-first brand marketing illustration showing Spotify playlists, podcast sponsorships, headphones, microphones, and growth metrics

For years, digital marketing has been dominated by sight: video, display, and social feeds. But in a world suffering from screen fatigue, the audience’s attention is shifting to the oldest, most intimate medium of all: audio.

Contrast between screen fatigue and audio engagement using podcasts, branded playlists, and headphones

When screens overwhelm, audio connects.

Brands that are truly winning on platforms like Spotify and across the podcast ecosystem are looking past the standard 30-second pre-roll spot. They are moving from audio advertising to audio storytelling, embedding their identity into the listening experience itself.

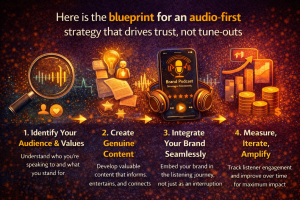
Here is the blueprint for an audio-first strategy that drives trust, not tune-outs.

Audio-first marketing blueprint showing audience research, content creation, brand integration, and performance measurement

From audience insight to measurable impact, this is how audio strategies actually work.

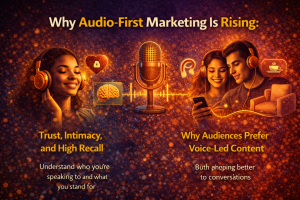
  1. Why Audio-First Marketing Is Rising

Audio is uniquely positioned in the modern media landscape. It doesn’t require a screen and accompanies the listener during key moments of their day: commuting, working out, or cooking.

  • Trust, Intimacy, and High Recall: Listening through earbuds or in a car is a deeply personal experience. A human voice sharing a story fosters a connection that a fleeting video ad often cannot replicate. This intimacy leads to higher recall—listeners remember audio messages more than billboards.
  • Why Audiences Prefer Voice-Led Content: Listeners actively choose their podcasts or playlists, creating a “lean-in” environment. When ads feel less intrusive and more integrated, they are welcomed as content, not interruptions.
Audio-first marketing illustration showing headphones, microphone, sound waves, and emotional connection symbols

Audio builds trust where screens create fatigue. That’s why brands are leaning into voice-led marketing.

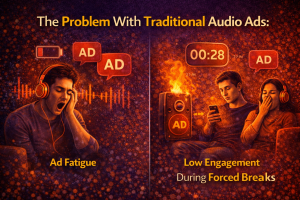
  1. The Problem With Traditional Audio Ads

The basic programmatic audio ad is suffering from the same issues as banner blindness.

  • Ad Fatigue: Repeatedly hearing the same, often generic, 15-30 second spot creates resentment and the immediate urge to skip (if possible).
  • Low Engagement During Forced Breaks: Standard ads interrupt the flow of content, turning an active listening moment into a passive, screen-gazing moment, or worse, a moment of distraction.
The Problem With Traditional Audio Ads: Fatigue and Forced Listening

Listeners experiencing ad fatigue and low engagement during forced traditional audio advertisements

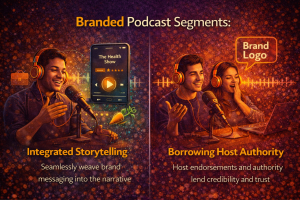
  1. Branded Podcast Segments

Instead of buying a slot before or after an episode, a branded segment integrates the brand into the core content.

  • Integrated Storytelling: The brand funds a recurring, relevant section of the show. For example, a financial services brand sponsoring “The Market Movers” segment where the host breaks down the week’s economic news.
  • Borrowing Host Authority: The host, who has earned the listener’s trust, introduces the segment, effectively giving the brand their implicit endorsement. This is less like an ad and more like a collaboration. (See examples like Choiceology by Charles Schwab).
Branded podcast segments featuring integrated storytelling and host authority to build brand trust

Don’t interrupt the story. Become part of it.

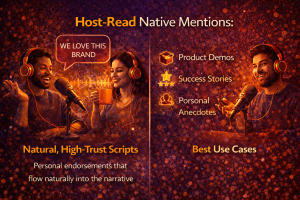
  1. Host-Read Native Mentions

This is the ultimate high-trust script. The key is to keep it natural and avoid the over-promotional tone.

  • Natural, High-Trust Scripts: The host reads the script in their own voice, often adding personal context or a quick anecdote about how they genuinely use the product. This makes the pitch feel like advice from a friend.
  • Best Use Cases: Ideal for products that are easily integrated into the host’s lifestyle (e.g., productivity apps, meal kits, comfortable clothing, or specialized software).
Podcast hosts delivering natural host-read brand mentions using high-trust scripts and authentic storytelling

When hosts believe it, audiences feel it.

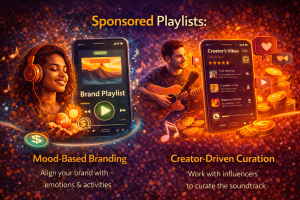
  1. Sponsored Playlists

Spotify offers a unique, mood-based entry point for brands to connect with listeners who are not actively seeking conversation.

  • Mood-Based Branding: A car manufacturer sponsors “The Ultimate Road Trip Playlist.” A coffee brand sponsors “Focus Flow: Deep Work Beats.” The brand owns the feeling and context of the listening moment, fostering a positive association.
  • Creator-Driven Curation: Brands can partner with influential playlist curators on Spotify to access their ready-made, highly engaged audiences, ensuring the playlist content feels authentic to the listener. Sponsoring personalized playlists like “Discover Weekly” or “On Repeat” connects the brand with the user’s current music habits.
Sponsored music playlists featuring brand playlists, creator curation, and mood-based audio branding on streaming platforms

Turn moods into moments. Sponsored playlists let brands live inside the soundtrack of everyday life.

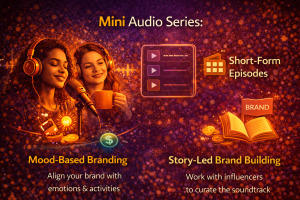
  1. Mini Audio Series

This is the branded content evolution of the blog post—creating short, episodic, and highly focused audio content.

  • Short-Form Episodes: Episodes are typically 5-10 minutes long, designed for a micro-moment (like a morning commute). The content focuses entirely on educating or entertaining, with the brand taking a backseat.
  • Story-Led Brand Building: Brands like GE have launched successful sci-fi podcasts (The Message) that never mention the product, but embody the brand’s spirit of innovation and technology.
Mini audio series marketing with short-form episodes and narrative-driven brand storytelling

Short episodes. Long-term brand love.

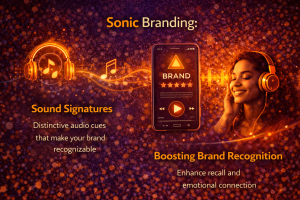
  1. Sonic Branding

Sonic branding, or the creation of a recognizable sound signature, ensures your brand is recognized in screenless environments.

  • Sound Signatures: This is the short, unique sound (or “audio logo”) that immediately cues your brand. It must be consistent across all audio touchpoints—ads, smart speaker interactions, and even phone hold music.
  • Boosting Brand Recognition: When the sonic logo is effective, brands can achieve high recognition even without stating their name, as McDonald’s demonstrated in a recent campaign.
Sonic branding visuals with sound signatures, brand audio cues, and emotional connection through music

When your brand becomes recognizable by sound alone.

  1. Measuring What Matters

Clicks are a limited metric in audio. Success is measured by deeper, upper-funnel indicators.

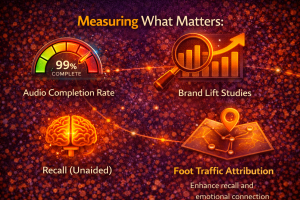
Audio marketing performance metrics showing completion rate, brand lift, recall, and foot traffic attribution

Because plays mean nothing without impact.

  1. Audio Completion Rate
  • Why It Matters: Shows the percentage of ads heard fully (typically high, >90%).
  • Measurement Tool: Streaming Platform Analytics
  1. Brand Lift Studies
  • Why It Matters: Measures changes in awareness, favorability, and purchase intent between exposed vs. control groups.
  • Measurement Tool: Third-party survey providers (Nielsen, Kantar)
  1. Recall (Unaided)
  • Why It Matters: Measures if the audience remembers the brand or message without prompting.
  • Measurement Tool: Post-campaign surveys
  1. Foot Traffic Attribution
  • Why It Matters: For retail/physical goods, measures store visits after listeners are exposed to a geo-targeted ad.
  • Measurement Tool: Location analytics platforms
  1. Common Mistakes
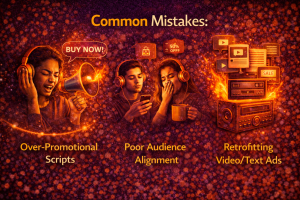
  • Over-Promotional Scripts: Sounding like a loud, rushed radio announcer breaks the intimate connection of the platform.
  • Poor Audience Alignment: Sponsoring a fitness podcast for an audience of retirees. The message must fit the mood and demographic.
  • Retrofitting Video/Text Ads: An audio-first strategy means the message must be conceptualized for sound, not just copied from a video script.
Common audio marketing mistakes including over-promotional scripts, poor audience alignment, and retrofitted ads

Why most audio campaigns fail before they even start.

  1. Your Audio-First Action Plan

Choosing Formats

  1. If budget is low & audience is niche: Start with Host-Read Native Mentions on a small, highly relevant podcast.
  2. If the goal is awareness & scale: Invest in Sponsored Playlists and a strong Sonic Brand.
  3. If the goal is thought leadership & trust: Commit to a Mini Audio Series or a Branded Podcast Segment.
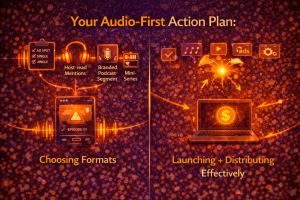
Audio-first marketing action plan showing podcast formats, branded segments, mini-series, and distribution strategy

A practical roadmap for launching and scaling an audio-first marketing strategy that actually converts.

Launching + Distributing Effectively

Remember: Audio is not just distribution; it’s creation. You must align your tone, format, and content to the unique consumption habits of listeners to truly win outside of the standard ad slot.

Red Flags to Watch Out For: When It’s Time to Fire Your Social Media Agency (And What to Hire Next)

Person looking through binoculars symbolizing red flags to watch out for before firing a social media agency

Your social media budget is significant. You hired an agency to unlock growth, manage your community, and keep your brand current. Yet, lately, the content feels flat, the reporting is confusing, and the results have stalled.

It’s a common dilemma: most social media agencies start strong, but over time, they hit a wall, reverting to safe, templated work. Knowing when to cut ties isn’t about frustration; it’s about recognizing the critical red flags that signal a fundamental lack of strategy and, ultimately, a waste of your budget.

Business owner reviewing social media budget and contract showing wasted spend and poor agency performance

Flat content. Confusing reports. Burned budgets. These are the warning signs no brand should ignore.

Here is a checklist of warning signs and a guide on what your next, more effective partnership should look like.

Red Flags to Watch Out For in a Social Media Agency

Checklist comparing social media agency warning signs versus qualities of a better strategic partner

  1. The Hidden Problem: Why Most Agencies Stop Delivering

The early success of a new partnership often comes from low-hanging fruit—fixing basic errors and setting up core processes. But sustained growth requires constant evolution, which many agencies fail to deliver due to internal pressures or creative exhaustion.

  • Plateaued Results: Growth isn’t accelerating; it’s flatlining, despite consistent posting.
  • Copy-Paste Strategies: They’re deploying the same content calendar framework for you as they are for a client in a completely different industry.
  • Zero Platform Innovation: They fail to adapt to new features (Reels, TikTok) or emerging trends, keeping you stuck on outdated formats.
Social media agency performance issues showing plateaued results, copy-paste strategies, and lack of innovation

When growth stalls, creativity fades, and strategies look recycled, it’s not bad luck — it’s a broken agency model.

  1. Red Flag #1: Vanity Metrics Instead of Real Growth

A high follower count or a lot of “Likes” is cheap. True value is in the numbers that drive your business.

  • Likes vs Revenue: They obsess over engagement rate percentages while ignoring the cost per acquisition (CPA) or return on ad spend (ROAS) from social media.
  • Fake “Performance” Reporting: Reports are filled with obscure metrics and graphs showing only positive trends (e.g., “Post Reach Up 2%”) but never linking that reach to a business outcome.
  • No Clarity on ROI: You cannot definitively say, “For every dollar we pay this agency, we get X dollars back in traceable business value.”
Graphic comparing social media likes versus revenue with fake performance reporting and unclear ROI

Likes look good. Revenue matters more.
If reporting focuses on vanity metrics instead of ROI, growth is only an illusion.

  1. Red Flag #2: Slow Response Times & Missed Deadlines

Poor communication signals chaos and a lack of respect for your brand’s timeline. In fast-paced social media, delays are deadly.

  • Delayed Approvals: It takes days, not hours, to get simple copy or asset approval requests.
  • Missed Posting Windows: Content is posted late or, worse, completely misses a critical trend or seasonal moment.
  • Communication Gaps: You don’t know who your main point of contact is, and urgent requests are often passed around or ignored.
Illustration showing delayed approvals, missed posting windows, and communication gaps in social media management

Slow replies. Missed deadlines. Lost momentum.
When response times lag, opportunities slip away and campaigns lose impact.

  1. Red Flag #3: Recycled Templates and Generic Content

Creative fatigue is a sign that your account is being managed by a production line, not a creative partner.

  • Same Designs Across Clients: You recognize your brand’s content structure or aesthetic is identical to another client in their portfolio.
  • No Creativity or Brand Personality: The content is “safe,” bland, and does nothing to distinguish your brand’s unique voice.
  • Obvious Canva Template Fatigue: You see standard fonts, stock imagery, and template layouts that any intern could produce.
If every post looks the same, your brand disappears. Generic templates don’t build identity or connection.

Visual showing repeated social media templates across brands highlighting lack of creativity and Canva fatigue

  1. Red Flag #4: No Understanding of Your Industry

An agency that doesn’t “get” your niche audience will always miss the mark.

  • Wrong Audience Targeting: They suggest campaigns aimed at demographics that don’t buy your product or don’t represent your ideal customer profile (ICP).
  • Irrelevant Content Ideas: They pitch content based on general social media trends that have nothing to do with your product or industry pain points.
  • Strategy That Feels Disconnected: The team hasn’t invested the time to understand your industry’s jargon, competitive landscape, or regulatory environment.
This image illustrates how a lack of industry knowledge leads to ineffective social media strategy.

Social media strategy failing due to wrong audience targeting and lack of industry understanding

  1. Red Flag #5: Zero Proactive Ideas

A good agency leads the strategy; a bad one follows instructions.

  • Waiting for You to Guide Them: They only create content based on the assets or ideas you hand them.
  • No Trend Spotting: They miss emerging platform features (e.g., live audio, new sticker formats) or viral content opportunities relevant to your brand.
  • No Optimization Suggestions: They report on results but never propose a fix for poor performance (e.g., “This ad performed poorly,” without suggesting, “We should pivot the creative to focus on Benefit B”).
Social media agency showing no proactive ideas, trend spotting, or optimization strategy

If you’re doing all the thinking, you’re not getting a partner. You’re managing a vendor.

  1. Red Flag #6: Misaligned Ads & Wasted Budget

Social media advertising requires continuous monitoring and micro-optimization.

  • Poor Targeting: Your ad dollars are wasted serving impressions to unqualified audiences.
  • No A/B Testing: They are running one creative or one ad copy variation, proving they don’t understand the necessary process of iteration.
  • “Set and Forget” Campaigns: Campaigns are launched and ignored until the end of the reporting cycle, resulting in inefficient spend.
Misaligned social media ads showing poor targeting, no A/B testing, and wasted advertising budget

Running ads without strategy is the fastest way to burn budget. Poor targeting, zero testing, and “set-and-forget” campaigns kill ROI fast.

  1. When It’s Officially Time to Fire Your Agency

The decision should be based on a breach of core expectations, not just one bad month.

  • Key Criteria: Consistent failure to meet pre-agreed targets for leading indicators (e.g., qualified clicks, conversions, CPA).
  • Signs It Won’t Improve: The agency’s response to your concerns is defensive, dismissive, or blames the platform/market instead of providing a clear, revised plan.
  • How to Exit Smoothly: Consult your contract for termination clauses. Give a 30-day notice, document all underperformance, and ensure all asset access (passwords, ad accounts) is transferred back before the final payment.
Business owner reviewing warning signs and planning a professional exit from an underperforming social media agency

Knowing when to walk away is a strategy move, not an emotional one.

  1. What to Look for in Your Next Social Media Partner

Don’t hire another templated factory. Hire a strategic, creative partner.

  • Data-Driven Creators: Look for teams that combine the creative skills of a UGC creator with the analytical rigor of a media buyer. They should talk about why a piece of content works, not just what it is.
  • Niche Industry Expertise: Prioritize partners who have worked with 1-2 companies in your vertical or who can demonstrate a deep understanding of your audience’s psychology.
  • Real Creative Strategy: They should present a mood board, a distinct brand voice, and specific, platform-native ideas (e.g., “We will use the duet feature on TikTok to drive engagement”).
  • Transparent Reporting: Reports must be delivered via a shared dashboard with live, unvarnished data tied directly to your business KPIs (CPA, ROAS, LTV).
Marketing professionals analyzing data dashboards and creative strategies to evaluate a social media agency partnership

The right partner doesn’t just post content. They understand your industry, your data, and your growth goals.

  1. The Future-Proof Agency Model

The winning agencies of the next decade are abandoning the large-retainer, corporate structure.

  • Hybrid Creator + Strategist Teams: Small, agile teams where the person who designs the graphic is the same person analyzing the performance data. This closes the feedback loop instantly.
  • Performance-First Content: Content is treated as a variable in a continuous testing process. Nothing is sacred; everything is tested and optimized.
  • Agile, Fast Turnaround Workflows: Emphasis on quick, imperfect, high-velocity content that responds to trends in 24 hours, not polished content that takes two weeks for approval.
The Future-Proof Social Media Agency Model Explained

Modern marketing team combining creativity, strategy, and performance analytics for scalable social media growth

It’s time to move past vanity metrics and generic strategies.

Business professionals reviewing social media performance, highlighting the shift from vanity metrics to investment-focused strategy

Likes look good on paper. Results look good on revenue. It’s time to treat social media as an investment, not a paycheck.

Your social media presence deserves a partner that treats your budget like an investment, not a steady paycheck.

Using User-Generated Content (UGC) Without Being Cringey: A 3-Step Approval Framework.

Illustration showing user generated content concept with community engagement and brand communication

User-Generated Content (UGC) is the ultimate social proof. It’s affordable, authentic, and drives more conversions than brand-created assets.

However, every marketer knows the dark side: the content that’s so awkward, staged, or off-brand that it makes your audience recoil.

How do you harness the power of real people without succumbing to the cringe?

UGC Approval Framework: Real Content vs. Red Flags

Side-by-side comparison of good and bad user-generated content examples

The answer is a structured, sanity-checking process. We’ve distilled it into a 3-Step UGC Approval Framework to help you consistently select and share content that builds, not burns, your brand trust.

What Makes UGC Powerful (and Why It Can Also Go Wrong)

Why brands lean on UGC

UGC is appealing because it tackles the modern consumer’s skepticism. People trust their peers far more than they trust brands.

  • Authenticity: It shows real people using your product in real life.
  • Cost-Effectiveness: It bypasses expensive production costs.
  • Scale: It provides a continuous, diverse stream of content.
  • Conversions: It acts as powerful social proof that shortens the buyer’s journey.
Why UGC Works — And Why It Fails

UGC approval framework with strengths and common pitfalls

The fine line between “authentic” and “awkward”

Authenticity doesn’t mean “anything goes.” It means “it feels real and relatable.”

  • Authentic: A genuine, unscripted review of a product’s main benefit.
  • Awkward/Cringey: A heavily scripted, over-enthusiastic video that looks like a bad infomercial, or a piece of content that forces a trend that doesn’t align with the brand’s voice.
The Fine Line Between Authentic and Awkward UGC

Authentic vs awkward user-generated content comparison chart

Common mistakes that turn UGC into cringe

  1. Forcing a Fit: Using a trending sound or format that has nothing to do with your product or brand identity.
  2. Over-Polishing: Editing UGC so heavily that it loses its raw, genuine feel (e.g., adding too many corporate graphics).
  3. Low Effort/Low Relevance: Sharing shaky, poorly lit, or completely irrelevant content just to say you’re using UGC.
  4. Misleading Claims: Content that implies benefits or results the product can’t deliver.
List of UGC mistakes (Forcing a Fit, Over-Polishing, Misrelevance) that lead to "cringe," and benefits of authentic UGC (Authenticity, Cost-Effectiveness, Conversions).

Avoid these common mistakes that destroy authenticity: Don’t force a trend, over-polish your videos, or make misrepresentations. Authenticity builds real brand trust.

The 3-Step UGC Approval Framework

This simple framework helps your team evaluate content quickly, keeping your standards high and your brand safe.

Step 1: The Relevance Check (The Brand Fit)

This step ensures the content serves your current marketing goal and reflects your established identity.

  1. Does it fit the brand?
  • Pass Criteria: The content aligns with brand values, tone, and visual aesthetic.
  • Fail Criteria: The user/setting/activity feels completely foreign or inappropriate for the brand.
  1. Does it match the message?
  • Pass Criteria: It highlights the intended product benefit or solves a key customer problem.
  • Fail Criteria: It focuses on a feature that is not a selling point or is totally off-topic.
  1. Does the tone feel natural?
  • Pass Criteria: The user’s enthusiasm feels genuine, not forced or overly performative.
  • Fail Criteria: The content is overly scripted, overly dramatic, or has an unnatural, forced vibe.
Flowchart of the 3-Step UGC Approval Framework: 1. Relevance Check (Brand Fit), 2. Match the Message (Product Benefit), 3. Tone feels Natural (Genuine Enthusiasm).

Before posting, use this 3-Step UGC Approval Framework: Check for Brand Fit, ensure it highlights the product benefit, and confirm the tone feels genuinely natural.

Step 2: The Credibility Check (The Trust Factor)

This is the most critical step for risk mitigation and maintaining audience trust.

Is it real, reliable, and safe to share?

  • Spotting staged, low-trust, or misleading UGC: Look for clear signs of overly professional lighting, perfect sets, or language that is clearly reading from a teleprompter. A good rule of thumb: If it looks too perfect, it probably is.
  • Legal considerations (permissions, rights, disclaimers): Never use content without express, written permission from the creator. For content that makes bold claims (e.g., health/financial results), you must include appropriate disclaimers like “Results may vary.”
Comparison of 'Too Perfect' (low-trust, staged) UGC versus 'Real & Reliable' (high-trust, authentic) UGC, plus an image of a legal Express Permission document.

UGC should be real, not ‘too perfect.’ Always prioritize genuine, reliable content over overly staged videos, and ensure you have express legal permission to use the content.

Step 3: The Quality Check (The Execution)

While UGC is meant to be raw, it still needs to be consumable. Poor quality diminishes the message.

Is the storytelling strong enough?

Even a short video should have a clear beginning (hook), middle (product use/benefit), and end (call-to-action/conclusion). If the user rambles, the message will get lost.

Diagram showing the ideal UGC storytelling structure and a checklist for visual and audio clarity (Clear Audio, Stable Video).

UGC must be “consumable.” Ensure your content has a strong storytelling structure (Hook, Product/Benefit, Conclusion, CTA) and clear visual/audio quality.

The Quality Check (The Execution)

While UGC is meant to be raw, it still needs to be consumable. Poor quality diminishes the message.

  1. Visual Quality
  • Guidelines: Clearly in focus, reasonably well-lit (no shadows obscuring the face or product).
  1. Audio Quality
  • Guidelines: Clear, understandable voiceover; minimal background noise; no abrupt cuts.
  1. When to enhance and when to leave it raw
  • Enhance (Acceptable Edits): Minor color correction, stable background music addition, adding simple text overlays.
  • Leave Raw (Avoid Over-Polishing): Overly enthusiastic voiceovers, overly smooth video editing, adding corporate logos that clutter the screen.

What Good UGC Actually Looks Like

Good UGC doesn’t look like a commercial; it looks like a friend’s recommendation.

Examples of UGC that feels real, not forced

  • A travel brand sharing a 15-second “day in the life” Reel captured on a phone by a traveler.
  • A software company sharing a screen-recorded tutorial from a customer showing how they integrated the tool into their complex workflow.
  • A skincare brand showing an unfiltered, natural light before-and-after shot of a user’s skin after one month of use.
Infographic titled "What Good UGC Actually Looks Like," showing three examples: a "Travel Brand" photo of an "Italy Trip" on a phone, a "Software Company" showing a code screenshot on a monitor, and a "Skincare Brand" before-and-after photo showing results from "ClearGlow Serum."

Good User-Generated Content (UGC) isn’t polished like a commercial—it looks like a genuine friend’s recommendation! See examples of authentic UGC for a Travel Brand, a Software Company, and a Skincare Brand.

Before/After: Cringey vs. Clean Executions

Example 1: Over-Enthusiasm vs. Specific Benefit

  • Cringey Execution: “OMG, I can’t believe how much I love this blender! It’s changed my life!” (Overly enthusiastic, zero context.)
  • Clean Execution: A user filming their smoothie making, saying, “My old blender used to leak. This one makes cleanup a 2-second rinse, and I’m out the door.” (Specific, relatable pain point solved.)
Comparison of bad UGC (static, pixelated photo with a vague claim) versus good UGC (well-lit video showing a projector's crystal-clear image in action).

A Clean Execution is a well-lit video showing the product’s key action with a genuine reaction. Avoid low-effort, static, pixelated photos with vague claims.

Example 2: Low Effort vs. Quality Demonstration

  • Cringey Execution: A static, pixelated photo with the user’s entire face cut out, saying the product is “good.”
  • Clean Execution: A well-lit, short video review showing the product’s key feature in action, with a genuine smile.
Comparison of bad UGC (overly enthusiastic blender testimonial) versus good UGC (close-up of a blender solving a specific user pain point).

Clean UGC focuses on a specific, relatable pain point solved, like a faster clean, rather than generic, overly enthusiastic claims with zero context.

How to Guide Creators Without Killing Authenticity

You need to set guardrails without handing them a script.

Soft prompts vs hard scripts

  • Hard Script (Avoid): “Hi, I’m Sarah, and I am going to talk about Feature X. The main benefit is Y.”
  • Soft Prompt (Use): “Share your honest first impression. What was the one thing this product solved for you today? Film in a well-lit area showing the product in the first 5 seconds.”
Soft Prompts vs. Hard Scripts: Guiding UGC Creators Authentically

Comparison chart showing that Soft Prompts (honest impression, product solution) should be used, while Hard Scripts (overly specific, robotic dialogue) should be avoided when guiding UGC creators.

Simple shot lists that still feel organic

Instead of dictating dialogue, request key shots:

  1. Unboxing/First Use Shot (The “Discovery”)
  2. Product In Action Shot (The “Proof”)
  3. Final Reaction/Summary Shot (The “Benefit”)
Organic UGC Storytelling: Unboxing, Proof, and Final Reaction Shots

Three-panel shot list for organic UGC: Unboxing (‘The Discovery’), Product in Action (‘The Proof’), and Final Reaction/Summary (‘The Benefit’).

How to protect the “real” feel while keeping standards

Clearly communicate that minor editing and text overlays will be added by the brand to ensure clarity, but that their voice and message are the priority. This manages expectations and maintains the raw content you need.

Diptych comparing a "raw content" photo of a woman holding a "Save Our Park!" sign with an "enhanced clarity" version, illustrating how minor edits amplify the message while keeping the authentic feel.

The power of balance: See how minor edits for clarity (Our Standards) can amplify your original voice and vision (The Real Feel) without compromising the authenticity of your message. Your message, amplified.

Where to Use High-Quality UGC in Your Funnel

  1. Awareness/Engagement Stage
  • Placement: Reels, Shorts, TikTok
  • Goal: Capture attention with relatable content; drive traffic.
  1. Consideration/Interest Stage
  • Placement: Product Pages, Landing Pages
  • Goal: Build trust by showing how the product works for others.
  1. Decision/Conversion Stage
  • Placement: Ads, Retargeting Campaigns
  • Goal: Use UGC as a direct “Proof” ad to overcome final objections.
  1. Trust/Retention Stage
  • Placement: Testimonial Sections, Email Signatures
  • Goal: Reassure new buyers and encourage repeat purchases.
Diagram showing high-quality User-Generated Content (UGC) placement across the four stages of the marketing funnel: Awareness, Consideration, Decision, and Trust/Retention.

Strategically place UGC throughout your funnel: use Reels/TikTok for Awareness, Product Pages for Consideration, Ads for Decision, and Testimonials/Emails for Trust.

Mistakes to Avoid at All Costs

These instantly trigger the cringe response:

  • Over-editing: Adding cinematic cuts or over-the-top corporate graphics.
  • Fake UGC actors: Hiring actors to pretend to be a real customer. This is transparent and damaging.
  • Scripts pretending to be spontaneous: Content where the user clearly memorized a corporate script.
  • Overuse of trends that don’t fit the brand: A serious B2B brand attempting a silly, dancing TikTok trend.
List of four major mistakes in UGC: Over-editing, using Fake UGC actors, Scripts pretending to be spontaneous, and Overuse of trends.

Instantly trigger the cringe response by over-editing, using fake actors, forcing a corporate script, or having a serious brand overuse silly trends.

Final Checklist: The UGC Green-Flag Scorecard

Six-point UGC checklist covering Relevance, Authenticity, Tone, Clarity, Legal, and Message to ensure high-quality content.

Use the UGC Green-Flag Scorecard before publishing: Check for Relevance, Authenticity (real person), Tone, Clarity, Legal permission, and a clear Message in the first 5 seconds.

  1. Relevance
  • Criteria: Does it directly mention or show the product?
  1. Tone
  • Criteria: Does the tone align with our brand voice (fun, serious, educational, etc.)?
  1. Authenticity
  • Criteria: Does it feel like a real person, not a paid actor reading a script?
  1. Legal
  • Criteria: Do we have explicit permission/usage rights from the creator?
  1. Clarity
  • Criteria: Is the audio clear and the visuals reasonably in focus?
  1. Message
  • Criteria: Is the core benefit/message clear in the first 5 seconds?

The 5 Visual Trends That Will Dominate Q4 2025 Social Media Marketing

The 5 Visual Trends That Will Dominate Q4 2025 Social Media Marketing

Short-Form Motion Graphics Become the New Standard

This goes beyond simple AI art; this is about photorealistic wonder seamlessly integrated into high-quality content. Think surreal product mockups, impossible architecture, or hyper-detailed fantasy scenes that look like they were shot for a blockbuster movie.

  • Why it Works: It delivers pure, unadulterated curiosity. These visuals force a pause and trigger the “How did they do that?” curiosity that fuels high-value shares and saves.
  • The Vibe: Cinematic, impossible, and polished to perfection.
Why Q4 Visuals Will Make or Break Your 2025 Social Media Strategy

Futuristic digital wall of visuals showcasing Q4 2025 social media trends

Trend #1: Hyper-Real AI Visuals Take Over Introduction: Why Q4 Visuals Are a Life-or-Death Strategy

In the blink-and-you-miss-it world of social media, visual language is the new algorithm. What captivated audiences six months ago now feels dated.

As we barrel into Q4 2025—the busiest, most competitive, and most profitable quarter for marketers—staying ahead isn’t just an advantage; it’s survival.

The modern audience is complex: they crave the spectacular (hyper-real AI) and the sincere (raw authenticity). They demand immersion, whether through cinematic POV or the hypnotic simplicity of motion. Understanding these trends is the key to cutting through the holiday noise and capturing attention when conversion matters most.

Let’s dive into the five definitive visual trends that will dominate your feed and your strategy.

Trend #1: Hyper-Real AI Visuals Take Over

  • Definition: Stunningly realistic, often surreal, visuals (photorealistic dreamscapes, impossible mockups) seamlessly integrated into content.
  • Why it Works: Delivers pure curiosity (“How did they do that?”), forcing a pause and generating high-value shares/saves.
  • The Vibe: Cinematic, impossible, and polished to perfection.
Trend #1: Hyper-Real AI Visuals Take Over in Q4 2025

AI-enhanced futuristic smartphone design floating in a sci-fi environment

  • Examples:
    • Travel Agency: A Reel showing a suitcase opening to a swirling, photorealistic galaxy.
    • Coffee Brand: A static post where the mug’s steam forms an intricate, AI-generated cityscape.
    • Tech Company: A carousel showing a final image of an AI-generated office floating inside a biosphere dome.
Examples of Hyper-Real AI Visual Trends

AI-generated futuristic art including cosmic landscapes, neon environments, and imaginative worlds

Trend #2: Raw, Unfiltered “Real Life” Aesthetics

  • Definition: A celebration of the grainy, shaky, and unedited moment (behind-the-scenes chaos, iPhone-Notes-style text, UGC with poor lighting).
  • Why it Works: Builds trust through vulnerability and makes the content feel like a direct, private message from a friend.
  • The Vibe: Authentic, spontaneous, and high-trust.
Trend #2: Raw, Unfiltered Real-Life Aesthetic in Social Media

Authentic behind-the-scenes photos, iPhone notes text, and casual group moments

  • Examples:
    • Travel: A Reel titled “What my Greece trip really looked like,” showing short, beautiful clips followed by crowded streets and airport chaos.
    • Fashion: A static cellphone photo of a new dress hung on a door in messy room lighting, paired with a long, vulnerable caption.
    • Food & Beverage: A Story series showing the failed versions (messy bowls, burnt edges) of a new recipe before the perfect final shot.
Examples of Raw, Unfiltered Aesthetics Taking Over 2025

Unfiltered travel, home, and lifestyle content showcasing natural imperfections

Trend #3: Neon Noir & Futuristic Night Vibes

  • Definition: Uses deep blacks and rich navy blues as a canvas for vibrant neon pinks, cyans, and purples (electrified nights).
  • Why it Works: Evokes futuristic mystery, nightlife energy, and cutting-edge cool, immediately demanding attention.
  • The Vibe: Bold, high-contrast, and dynamic.
Trend #3: Neon Noir & Futuristic Night Vibes Dominate Q4 2025

Futuristic night cityscape with neon lights and cyberpunk color palette

  • Examples:
    • Fitness Brand: A POV Reel of a nighttime city run where streetlights and neon signs pulse with the music.
    • Beauty Brand: A tutorial shot under blacklight, with only the fluorescent pigments on the eyelids and lips popping.
    • Music Festival: A promo video color-graded entirely in deep blues and hot pinks, teasing the “future of nightlife.”
Examples of Neon Noir & Futuristic Visual Styles

Neon-lit running shot, UV beauty portrait, and futuristic music festival stage

 Trend #4: Minimalist Motion Graphics (Simple but Addictive)

  • Definition: Single, smooth micro-animations in an otherwise static image (animated text reveals, icons that morph, self-building data visualizations).
  • Why it Works: Increases dwell time and makes dense information feel digestible, leveraging the brain’s focus on movement.
  • Best Formats: Animated text reveals, clean data visualizations, gentle parallax effects.
Minimalist Motion Graphics: The Simple Visuals Taking Over Q4 2025

Minimalist motion graphics infographic with clean icons, neon outline, and simple data visuals

  • Examples:
    • Financial Service: A carousel where pie chart segments smoothly slide into place as the viewer swipes.
    • SaaS Brand: A static infographic where, after a second, the key metric gently pulses or a graph line draws itself.
    • Publisher: An Instagram Story quote where the text lines appear one by one, as if being typed.
Minimalist Motion Graphics in Action: Q4-Ready Examples

Examples of minimalist motion graphics including pie chart, line graph, and micro-animated social media cards

Trend #5: Cinematic POV Shots for Immersive Storytelling

  • Definition: Carefully framed, deliberately paced first-person shots where the camera becomes the viewer’s eyes (First-Person Narrative Style).
  • Why it Works: Triggers empathy and mirrors neural pathways, making the content incredibly sticky and boosting retention.
  • The Vibe: Immersive, experiential, and highly personal.
Cinematic POV Shots: The Most Immersive Visual Trend of Q4 2025

Cinematic POV storytelling infographic with neon cityscape and first-person scenes

  • Examples:
    • Travel: A Reel of “Opening your villa doors in Santorini,” showing the viewer’s hands pushing open the shutters to reveal the view.
    • Events/Concert: A Short where the POV is holding up a lighter/phone light during a power ballad in a crowd.
    • Product Launch: A TikTok showing the POV of chopping vegetables with effortless, satisfying precision using a new gadget.
Cinematic POV Content: High-Engagement Examples for Every Niche

POV examples for travel, concerts, and product content in futuristic neon design

Final Action Plan: How to Win Q4

You don’t need to do all five. You need to do the right one.

Audit Your Brand: Does your playful brand suit Neon Noir? Does your serious B2B suit Raw Aesthetics? Pick 1-2 trends that align naturally with your existing tone and Q4 goals (e.g., trust building vs. sales spectacle).

How to Match Your Brand With the Right Q4 Visual Trends

Brand audit infographic comparing neon noir visuals and raw aesthetics for Q4 strategy

Platform-Specific Tweaks:

    • Instagram Reels: Lean into Cinematic POV and Hyper-Real AI for high-impact discovery.
    • TikTok: Perfect for Raw Aesthetics and fast-paced, unedited storytelling.
    • LinkedIn/YouTube Shorts: Minimalist Motion Graphics and longer-format Educational POV stories perform well.                     
      Platform-Specific Visual Strategies for Instagram, TikTok & LinkedIn (Q4 2025)

      Platform visual strategy chart for Reels, TikTok, YouTube Shorts, and LinkedIn


Avoid the Biggest Mistake: Do not copy-paste a trend. Inject your brand’s specific colors, voice, and values into the template. Your version of the trend must still be instantly recognizable as you.

The #1 Visual Mistake Brands Make in Q4 (and How to Avoid It)

Comparison graphic showing generic copy-paste visuals vs unique branded content

The future of social media marketing in 2026 points to one theme: personalized immersion.

The Future of Social Media Marketing: Personalized Immersion in 2026

Futuristic infographic showing “The Spectacular vs The Sincere” merging into personalized immersion

The brands that learn to master the 2025 tension—blending the spectacular with the sincere—will be the ones ready to define what comes next.

Pay-Per-Click Advertising (PPC): Getting Started With Google Ads

Hand drawing PPC elements with doodles of money icons, mouse clicks, arrows, rocket, gears, and digital marketing symbols

Introduction: What Is Pay-Per-Click (PPC) Advertising?

In today’s digital landscape, getting your business in front of potential customers at the right moment is crucial. Pay-Per-Click (PPC) advertising offers a powerful solution, allowing you to display ads to users precisely when they’re searching for products or services like yours.

Understanding how PPC works is straightforward: you create and place ads on platforms like Google, and you only pay when someone actually clicks on them. It’s an auction-based system where advertisers bid for ad placement in search results and on websites across the internet.

Illustration showing a user clicking an online ad and how payment works in PPC

PPC lets businesses pay only when someone clicks their ads — fast, measurable, and effective.

Why businesses use Google Ads to grow faster comes down to immediacy and precision. Unlike organic methods that take months to show results, PPC can drive targeted traffic to your website from day one. Whether you’re launching a new product, promoting a special offer, or looking to scale your business quickly, Google Ads provides the tools to reach ready-to-buy customers instantly.

  1. How Google Ads Works

To succeed with PPC, you need to understand the fundamental mechanics behind Google’s advertising system.

The basics of bidding, ad rank, and quality score form the core of how ads compete:

  • Bidding: You set the maximum amount you’re willing to pay for a click
  • Ad Rank: This determines your ad position and is calculated using your bid × Quality Score
  • Quality Score: Google’s rating of your ad quality and relevance (based on CTR, ad relevance, and landing page experience)
Illustration explaining Google Ads bidding system and quality score components

A simple breakdown of how Google Ads determines which ads appear first.

Difference between search, display, shopping, and video ads:

  • Search Ads: Text ads that appear in Google search results when people search for your keywords
  • Display Ads: Visual banner ads that appear on websites within Google’s network
  • Shopping Ads: Product-based ads showing images, prices, and store names
  • Video Ads: Commercials that play before, during, or after YouTube videos
Overview of Google Ads formats including search ads, display ads, shopping ads, and video ads

A quick comparison of Google Ads formats to help advertisers choose the right one.

  1. Benefits of PPC Advertising

PPC offers unique advantages that make it an essential component of modern marketing strategies.

Immediate visibility and traffic: While SEO can take months to generate traffic, PPC can put you at the top of search results within hours of launching your campaign. This makes it ideal for time-sensitive promotions or new market entries.

Full control over budget and targeting: You decide exactly how much to spend daily and which audiences see your ads. Advanced targeting options let you reach users by location, demographics, interests, and even specific times of day.

Data-driven results and easy tracking: Every dollar spent is measurable. You can track conversions, phone calls, form submissions, and revenue, giving you clear insights into your return on investment.

Infographic showing PPC benefits like traffic boost, budget control, and data tracking

PPC delivers instant visibility, complete budget control, and powerful data insights.

  1. Setting Up Your First Google Ads Campaign

Launching your first campaign doesn’t need to be complicated. Follow this structured approach:

Step-by-step process to create an account:

  1. Visit ads.google.com and click “Start Now”
  2. Choose your campaign goal (Sales, Leads, or Website Traffic)
  3. Select your campaign type (Search, Display, Shopping, or Video)
  4. Set your budget and bidding strategy
  5. Define your target audience and location
  6. Create your ad groups and write your ads
Illustration of a person launching their first Google Ads campaign on a computer

A beginner-friendly visual for creating and launching your first Google Ads campaign.

Choosing your campaign type and goals depends on your objectives:

  • For direct sales: Search Network with Shopping ads
  • For brand awareness: Display or Video campaigns
  • For lead generation: Search Network with lead form extensions
Google Ads campaign objectives for lead generation, direct sales, and brand awareness

Pick the right campaign type based on whether you want leads, sales, or brand visibility.

  1. Keyword Research for PPC Success

Your keyword strategy determines who sees your ads and how much you pay for clicks.

Illustration of a magnifying glass character and a search bar representing keyword research

Good keyword research is the foundation of every profitable PPC campaign.

How to find profitable keywords:

  • Use Google’s Keyword Planner to discover search volume and competition
  • Analyze competitor keywords using tools like SEMrush or Ahrefs
  • Brainstorm from your customer’s perspective – what would they search for?
  • Focus on commercial intent keywords (e.g., “buy,” “price,” “near me”)
Infographic showing broad match, phrase match, exact match, and negative keyword icons

Match types control who sees your ads — and how relevant your traffic is.

Match types: broad, phrase, exact, and negative keywords:

  • Broad Match: Reaches widest audience but may include irrelevant searches
  • Phrase Match: Shows your ad for searches that include your exact phrase
  • Exact Match: Targets searches that match your term exactly or close variations
  • Negative Keywords: Prevents your ads from showing for irrelevant searches
  1. Crafting High-Performing Ad Copy
Illustration of marketers creating high-quality ad copy on a computer screen

Strong copy boosts clicks, conversions, and overall campaign success.

Great ad copy can double or triple your click-through rates while lowering your costs.

Writing compelling headlines and descriptions:

  • Include your primary keyword in at least one headline
  • Use numbers and power words (“Free,” “Now,” “Proven”)
  • Highlight unique selling propositions and benefits
  • Create a sense of urgency when appropriate
Illustration of a person crafting ad headlines and descriptions on a digital interface

Great PPC ads start with strong headlines and clear, persuasive descriptions.

Using emotional triggers and clear CTAs:

  • Address pain points and offer solutions
  • Incorporate emotional triggers like “Relief,” “Success,” or “Security”
  • Include clear, action-oriented CTAs (“Buy Now,” “Get Quote,” “Learn More”)
  • Use ad extensions to provide additional information and links
Illustration showing emotions and a “Buy Now” CTA to represent persuasive advertising

Emotions drive action. Clear CTAs drive conversions.

  1. Understanding Bidding Strategies and Budgeting

Smart bidding and budgeting are essential for maximizing your advertising ROI.

Manual vs. automated bidding:

  • Manual Bidding: Full control over your maximum CPC bids
  • Automated Bidding: Google’s AI optimizes bids toward your goals (conversions, clicks, or impressions)
  • Recommended for beginners: Start with Maximize Clicks or Target CPA
Illustration comparing manual bidding by a marketer and automated bidding by an AI robot

Manual gives control. Automated gives efficiency. Choose the bidding style that suits your goals.

How to optimize spend for maximum ROI:

  • Start with a conservative daily budget and scale up as you see results
  • Allocate more budget to high-performing keywords and ad groups
  • Use dayparting to show ads during your most profitable hours
  • Regularly review and adjust bids based on performance data
Illustration of a marketer analyzing charts and graphs to optimize PPC spending

Smart budgeting and data-driven decisions lead to higher ROI in your PPC campaigns.

  1. Designing Effective Landing Pages

Your landing page is where clicks turn into conversions – don’t waste expensive traffic on poor user experiences.

Illustration of a relevant landing page with check marks indicating good user experience

Relevant content + smooth UX = higher Quality Score and better conversions.

Importance of relevance and user experience:

  • Ensure your landing page directly relates to your ad copy and keywords
  • Create a seamless journey from ad click to conversion
  • Optimize for mobile devices (over 60% of searches happen on mobile)
  • Build trust with security badges, testimonials, and contact information
Landing page illustration showing conversion arrows, a “Buy Now” button, and performance indicators

A stronger landing page = higher conversions and fewer bounced visitors.

Tips for improving conversions and lowering bounce rates:

  • Use clear, compelling headlines that match your ad message
  • Include prominent, action-oriented call-to-action buttons
  • Remove unnecessary navigation that might distract from converting
  • Test different layouts, offers, and form lengths
  1. Tracking, Measuring, and Optimizing Campaigns

What gets measured gets improved. Proper tracking transforms random spending into strategic investment.

Using Google Analytics and conversion tracking:

  • Install the Google Ads conversion tracking tag on your website
  • Link your Google Analytics and Google Ads accounts
  • Set up goals to track valuable actions (purchases, form submissions, calls)
  • Use UTM parameters to track campaign performance in Analytics
Illustration of Google Analytics dashboard showing charts and metrics

Monitoring your data is the key to improving campaign results.

Key metrics: CTR, CPC, Quality Score, and ROAS:

  • CTR (Click-Through Rate): Percentage of people who click your ad after seeing it
  • CPC (Cost-Per-Click): Average amount you pay for each click
  • Quality Score: Google’s rating of your ad quality and relevance
  • ROAS (Return on Ad Spend): Revenue generated for every dollar spent
Illustration of CTR, CPC, Quality Score, and ROAS with charts and icons

Your four must-track PPC performance indicators: CTR, CPC, Quality Score, and ROAS.

  1. Common PPC Mistakes and How to Avoid Them
Infographic showing PPC mistakes like broad targeting and ignoring A/B testing

Avoid wasted spend by fixing these two common PPC pitfalls.

Learning from others’ mistakes can save you thousands of dollars and months of frustration.

Wasting money on broad targeting:

  • Start with exact and phrase match keywords before testing broad match.
  • Use negative keywords aggressively to filter out irrelevant traffic.
  • Segment your campaigns by theme rather than using one giant campaign.
Illustration showing wasted money, broad targeting symbol, segmented campaigns, and keyword match types

Stop letting your ad budget leak—use precise keywords and smarter segmentation.

Ignoring ad performance data and A/B testing:

  • Regularly test different ad copies, headlines, and CTAs.
  • Run A/B tests with significant sample sizes before making decisions.
  • Analyze performance data at least weekly and make incremental improvements.
  • Don’t set up campaigns and forget them – continuous optimization is key.
Creative illustration showing a sad laptop, falling ad performance chart, and A/B testing checklists

Skipping A/B testing and performance reviews can tank your results—optimize often.

  1. Advanced Tips for Scaling Your Google Ads
Illustration of remarketing, audience segmentation, and AI automation for scaling Google Ads campaigns

Smarter scaling through remarketing, segmentation, and AI-powered automation.

Once you’ve mastered the basics, these advanced strategies can help you scale your results.

Remarketing and audience segmentation:

  • Create remarketing campaigns to re-engage website visitors
  • Segment audiences based on behavior (page visits, time on site, cart abandoners)
  • Use customer match to upload your email list and create similar audiences
  • Layer audience targeting onto your search campaigns for better performance
Illustration of remarketing and audience segmentation with laptop, target icon, user avatars, and marketing elements

Reach the right people again with smart remarketing and precise audience segmentation.

AI tools and automation for smarter campaigns:

  • Utilize smart bidding strategies that leverage Google’s machine learning
  • Try responsive search ads that automatically test multiple headlines and descriptions
  • Use performance max campaigns for cross-channel reach
  • Implement automated rules for routine campaign management tasks
Futuristic illustration of an AI robot, smart bidding dashboard, and automated campaign elements

Let AI do the heavy lifting—smarter bidding, better performance, less manual effort.

Conclusion: From Clicks to Conversions

PPC advertising represents one of the most efficient ways to drive qualified traffic and measurable business results. When executed strategically, it transforms casual browsers into loyal customers and provides invaluable data about your market and audience.

How PPC fits into your overall marketing strategy should be complementary to your other efforts. Use PPC for immediate results while building long-term organic presence through SEO. Leverage PPC data to inform your content strategy and product development. The insights gained from what people click on and convert for can revolutionize your entire marketing approach.

Illustration of a laptop click turning into conversions through a funnel with rising charts and coins

A visual look at how every ad click flows through the funnel to generate real revenue.

Final thoughts on growing with Google Ads: Success with PPC requires patience, testing, and continuous learning. Start small, focus on mastering one campaign type, track everything, and scale what works. The businesses that thrive with Google Ads aren’t necessarily those with the biggest budgets, but those who are most strategic with their spending, most relevant with their messaging, and most diligent with their optimization. Your journey to PPC mastery begins with that first click – make it count.

Search Engine Optimization (SEO): What It Is And Why It Matters

Hands typing on a laptop with SEO graphics and digital marketing icons

Introduction: The Digital Landscape and the Need for SEO

Imagine you’ve just opened the most incredible store, filled with unique products and expert service. There’s just one problem: it’s located on a deserted street with no road signs pointing to it. How will customers find you? This is the challenge every website faces in the vast digital universe. With billions of web pages vying for attention, simply having a great website isn’t enough. You need a way to be found.


"Illustration of a small shop on a deserted road symbolizing websites without SEO"

A great website is useless if no one can find it—SEO changes that.

This is where Search Engine Optimization, or SEO, comes in. It’s the practice of optimizing your website to improve its visibility when people search for products, services, or information related to your business on search engines like Google, Bing, and others. The higher your pages rank in these search results, the more likely you are to attract visitors and, ultimately, customers.

Why SEO is crucial for online visibility is simple: search engines are the primary gateway to the internet for most people. If you’re not visible in search results, you’re missing out on a massive, targeted stream of potential traffic. SEO is the strategic process that ensures your business shows up when it matters most.

  1. What is SEO? A Clear Definition

At its core, Search Engine Optimization (SEO) is the art and science of making your website more attractive to search engines. The goal is to earn higher organic (non-paid) search engine rankings.

“Illustration explaining what SEO is, showing books labeled title, site structure, and backlinks beside search results.”

A simple breakdown of what SEO really means — making your website easier for search engines to understand and rank.

Think of search engines like a constantly updated library. SEO is the process of making sure your book (your website) has a compelling title (title tag), a clear table of contents (site structure), valuable content (quality information), and positive reviews from other authors (backlinks). This makes it easy for the librarian (the search engine) to recommend your book when someone asks a relevant question.

It’s crucial to understand the difference between organic search results and paid ads. Paid ads (Pay-Per-Click or PPC) appear at the top of search results with a small “Ad” label. You pay for that placement. Organic results, listed below the ads, are the “natural” listings that SEO aims to improve. While both are important, organic search typically drives the majority of search traffic and is perceived as more trustworthy by users.

  1. How Do Search Engines Work?

To master SEO, it helps to understand how search engines operate. They perform three primary functions:

Infographic explaining crawling, indexing, and ranking in search engines

How Google discovers, stores, and ranks your website.

  • Crawling: Search engines use automated programs called “bots” or “spiders” to discover publicly available content on the web. They crawl the internet by following links from one page to another.
  • Indexing: After crawling a page, the search engine processes and stores the information in a massive database known as an index. Think of the index as a giant library catalog that contains information about every web page the engine has found.
  • Ranking: When a user types a query, the search engine sifts through its index to find the most relevant and authoritative pages. It then orders these pages into a list of results—this is the ranking process. The complex algorithms that determine this order consider hundreds of factors.
  1. Core Pillars of SEO: A Three-Part Foundation

Effective SEO is built on three interconnected pillars:

"Core pillars of SEO infographic featuring on-page, off-page, and technical SEO icons"

The three pillars that shape every successful SEO strategy.

  • Technical SEO: This is the foundation. It involves optimizing the backend of your website so search engines can crawl and index it effectively. Key aspects include site speed, mobile-friendliness, clean URL structures, and a secure (HTTPS) connection. If your site has technical issues, it’s like having a store with a broken door—no one can get in, no matter how great your products are.
  • On-Page SEO: This focuses on optimizing individual web pages to rank higher. It includes elements that both users and search engines see, such as:
    • Keyword Research and Usage: Identifying the terms your audience searches for and using them strategically in your content.
    • Content Quality: Creating valuable, comprehensive, and engaging content that satisfies the user’s search intent.
    • Meta Tags: Crafting compelling title tags and meta descriptions that appear in search results.
    • Header Tags (H1, H2, H3): Structuring your content for readability and relevance.
  • Off-Page SEO: This is about building your website’s reputation and authority across the internet. The most significant factor here is link building—earning backlinks from other reputable websites. These links act as votes of confidence, telling search engines that your content is valuable and trustworthy. Social media mentions and brand citations also contribute to off-page SEO.
  1. Why SEO Matters: The Tangible Benefits

Investing in SEO isn’t just a marketing tactic; it’s a business strategy with powerful returns:

“Infographic explaining benefits of SEO including organic traffic, cost-effectiveness, and credibility”

SEO gives you visibility, trust, and sustainable growth — all in one.

  • Increased Organic Traffic and Brand Visibility: Ranking on the first page of Google puts your brand in front of a massive audience. Even if users don’t click immediately, they see your brand name, building recognition and trust over time.
  • Cost-Effectiveness Compared to Paid Advertising: While SEO requires an investment of time and resources, the traffic it generates is “free” in the sense that you don’t pay for each click. This creates a sustainable source of leads and customers that can compound over time, unlike PPC, which stops the moment you stop paying.
  • Building Credibility and Trust with Your Audience: Users inherently trust search engines. A top organic ranking is seen as an implicit endorsement, signaling that your site is a credible source of information. High-quality SEO, which provides great content and a good user experience, directly builds this trust.
  1. Common SEO Myths and Misconceptions

The world of SEO is filled with outdated advice and myths. Let’s debunk a few:

“SEO myths infographic listing common misconceptions with icons”

Don’t fall for these SEO myths — they’re holding your growth back.

  • “SEO is a One-Time Task”: Search engine algorithms are constantly evolving, and competitors are always working to improve their own rankings. SEO is an ongoing process of monitoring, updating, and adapting.
  • “Keyword Stuffing is Effective”: In the early days of SEO, cramming keywords into content could boost rankings. Today, this practice is penalized by search engines. Modern SEO focuses on natural language and user intent.
  • “All Backlinks are Good Backlinks”: The quality of backlinks matters far more than the quantity. A single link from a highly authoritative site like Harvard.edu is worth more than thousands of links from low-quality, spammy directories.
  1. Essential SEO Tools for Beginners

You don’t need a massive budget to start with SEO. Several powerful tools are available:

“SEO tools infographic featuring Google Search Console, Google Analytics, Ahrefs, and SEMrush”

Start your SEO journey with the tools that actually matter.

  • Google Search Console: A free tool that shows you how Google views your site. It provides data on your search traffic, indexing status, and any technical errors that need fixing.
  • Google Analytics: Another essential free tool. It helps you understand your website visitors—who they are, how they found you, and what they do on your site.
  • Ahrefs Webmaster Tools / SEMrush: While their full suites are paid, these platforms offer free versions or trials that are excellent for keyword research and competitor analysis.
  1. The Future of SEO: Staying Ahead of the Curve

SEO is not static. To stay competitive, you must be aware of emerging trends:

“SEO future trends infographic with AI, UX, and E-E-A-T icons”

The future of SEO is smarter, more human, and driven by trust.

  • The Rise of AI and Machine Learning in Search (Google’s RankBrain, BERT): Google’s algorithms are increasingly focused on understanding user intent, not just keywords. Creating content that naturally answers questions is more important than ever.
  • Importance of User Experience (UX) as a Ranking Factor: Metrics like Core Web Vitals (loading speed, interactivity, visual stability), mobile-friendliness, and overall site usability are now direct ranking factors. A site that is easy and pleasant to use will be rewarded.
  • The Growing Significance of “E-E-A-T”: This stands for Experience, Expertise, Authoritativeness, and Trustworthiness. Google uses these principles to assess the quality of content, especially for “Your Money or Your Life” (YMYL) topics like health, finance, and legal advice. Demonstrating your E-E-A-T is crucial for ranking.

Conclusion: SEO is an Essential Long-Term Investment

Search Engine Optimization is much more than a technical checklist. It is a fundamental marketing discipline that aligns your website with the needs of both your audience and search engines. By creating a technically sound, user-friendly website filled with high-quality, authoritative content, you build a powerful asset that drives sustainable growth.

“SEO long-term investment infographic with growth chart and E-E-A-T icons”

SEO pays off over time — build authority, boost traffic, and stay ahead.

While SEO requires patience and consistent effort, the payoff is immense: a steady stream of targeted traffic, increased brand authority, and a significant competitive advantage. In today’s digital world, understanding and implementing SEO isn’t optional—it’s essential for any business that wants to be found online. Start with the basics, focus on providing real value to your users, and you’ll be well on your way to long-term success.